StatPecker Review 2026: Features, Pricing, Pros & Cons
Updated March 2026 · 12 min read · By PopularAiTools.ai
TL;DR
StatPecker is a solid ai data visualization tool that delivers on its core promise. StatPecker is a free AI-powered data visualization platform that transforms raw data into compelling infographics and charts through natural language queries, making professional data storytelling accessible to non-technical users without design or coding skills. Best of all, it is completely free to use. It excels for content creators, marketers, business analysts, and non-technical professionals who need to communicate data-driven insights visually. Rating: 4.0/5
What is StatPecker?
StatPecker is a free AI-powered data visualization platform that transforms raw data into compelling infographics and charts through natural language queries, making professional data storytelling accessible to non-technical users without design or coding skills.
StatPecker operates in the ai data visualization space, which has seen significant growth in 2026 as businesses and creators increasingly rely on AI-powered tools to streamline workflows and reduce costs. What sets StatPecker apart from competitors is its focused approach to solving specific pain points that users encounter daily.
The platform has positioned itself as a compelling option for content creators, marketers, business analysts, and non-technical professionals who need to communicate data-driven insights visually, offering a combination of powerful features and accessible pricing that makes advanced AI capabilities available without enterprise-level budgets.

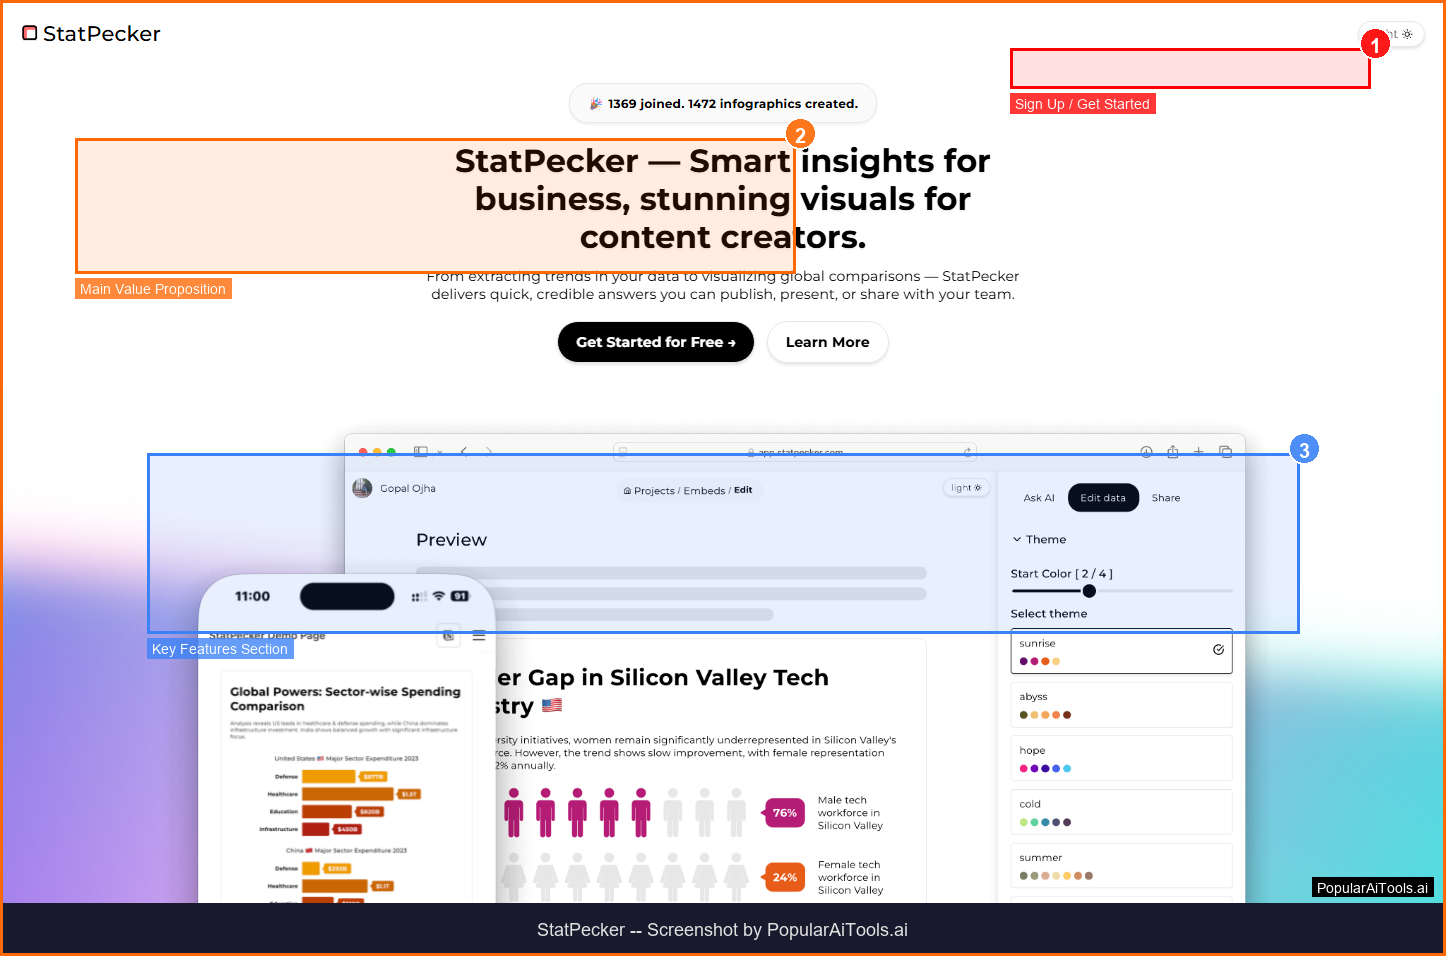
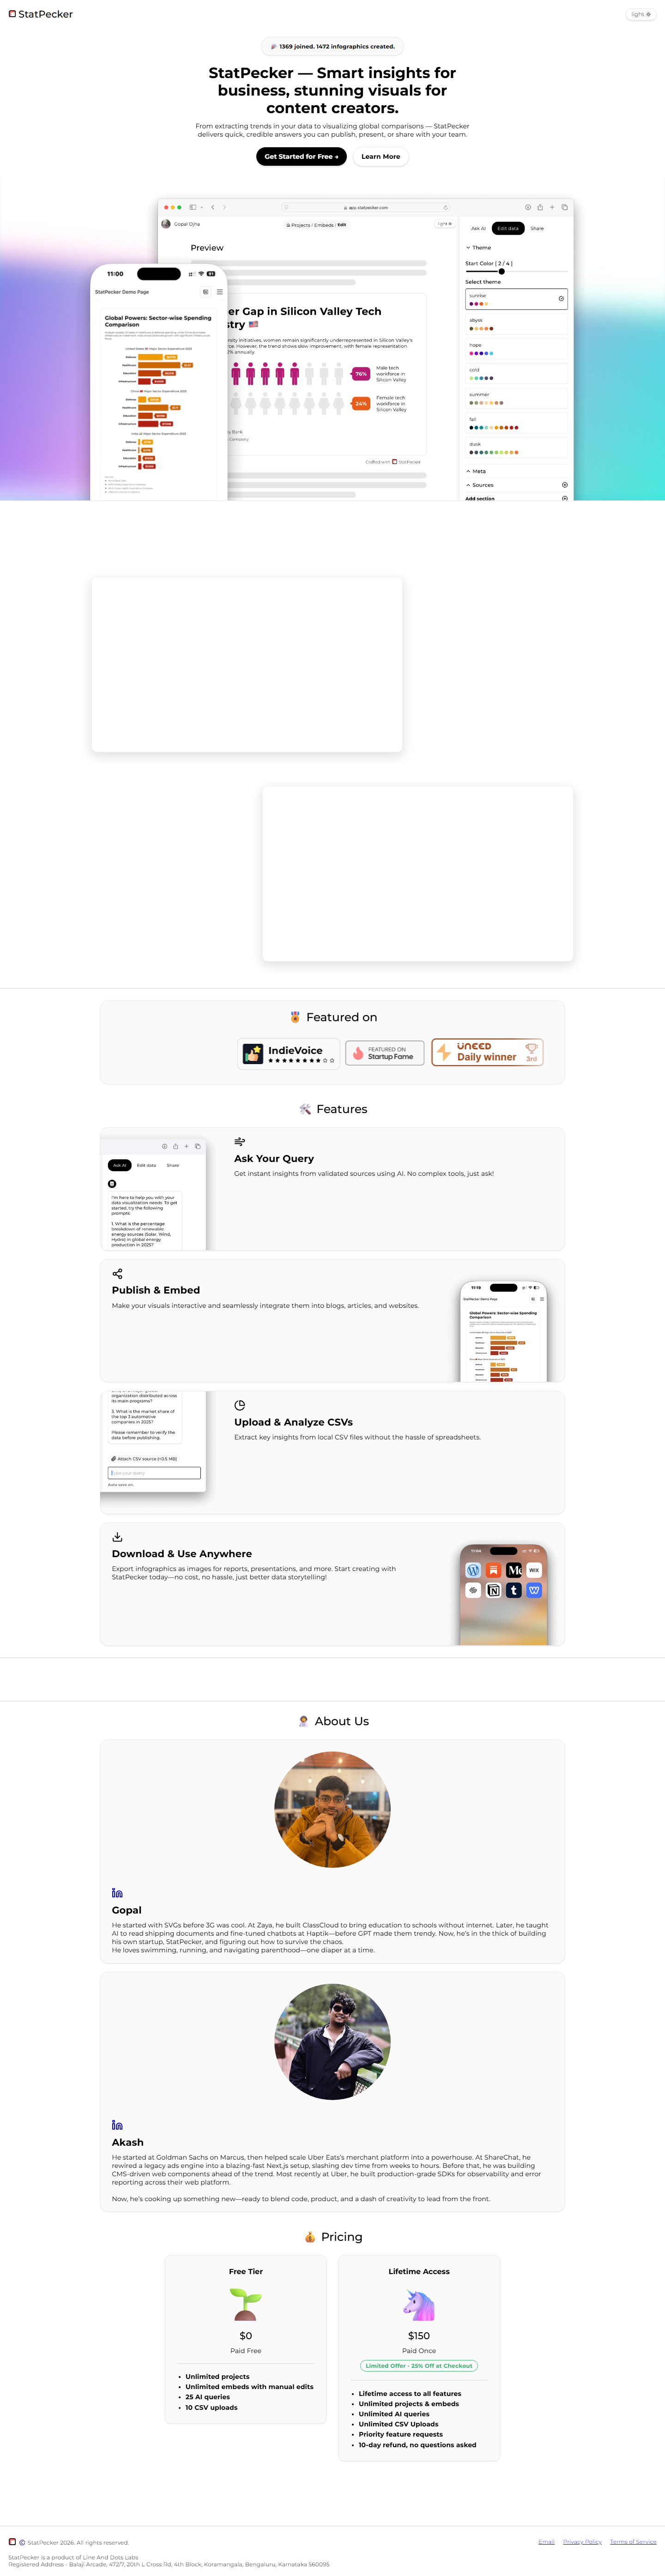
StatPecker homepage - Screenshot by PopularAiTools.ai
Key Features
1. Natural Language Queries
Ask questions about your data in plain English and StatPecker generates relevant visualizations automatically.
2. CSV File Analysis
Upload CSV files and extract key insights without the complexities of traditional spreadsheet software.
3. AI Trend Detection
The AI engine analyzes datasets to identify patterns, trends, and outliers, presenting them through clear visualizations.
4. Interactive Infographics
Create interactive visuals that can be embedded in websites, blogs, and articles for enhanced user engagement.
5. Professional Templates
Access pre-built visualization templates for common data storytelling scenarios and business presentations.
6. Image Export
Export infographics as high-quality images for inclusion in reports, presentations, and professional documents.
7. Customizable Styling
Adjust colors, fonts, layouts, and chart types to match your brand or presentation requirements.
8. Web Embedding
Embed interactive visualizations directly into websites and blog posts with simple embed codes.
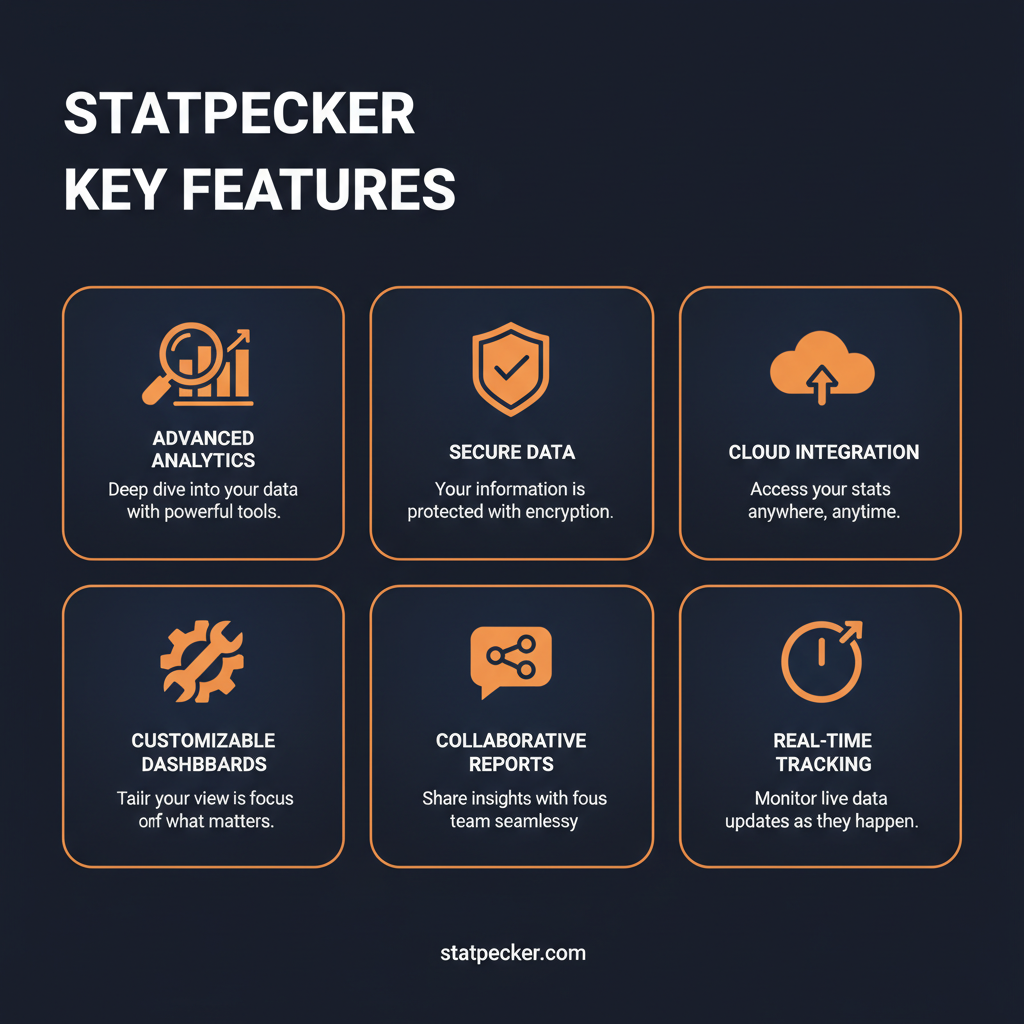
StatPecker key features at a glance
How to Use StatPecker (Step-by-Step)
Step 1: Visit the Website
Go to https://app.statpecker.com and click the sign-up or get started button.
Step 2: Create Your Account
Register with your email address or sign in with Google/GitHub. Most plans offer a free tier or trial.
Step 3: Explore the Dashboard
Once logged in, familiarize yourself with StatPecker's main interface and navigation.
Step 4: Configure Your Settings
Set up your preferences, connect any required integrations, and customize StatPecker to your workflow.
Step 5: Start Using Core Features
Begin using StatPecker's primary features. Refer to the documentation or in-app tutorials for guidance.
Pricing Plans
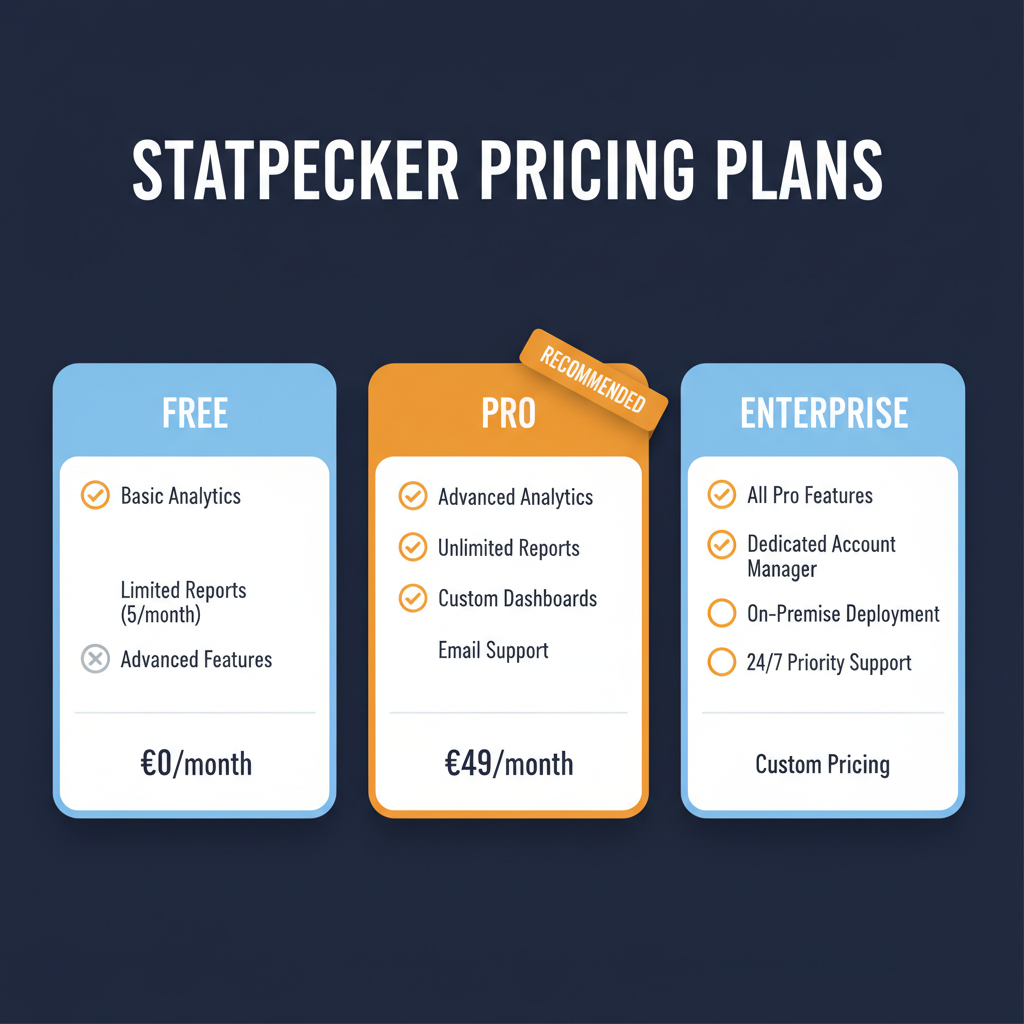
StatPecker pricing plans for 2026

Pros and Cons
Pros
- ✓ Completely free to use with full feature access
- ✓ Natural language interface eliminates technical barriers
- ✓ AI automatically identifies trends and insights in data
- ✓ Interactive visualizations can be embedded in websites
- ✓ No design skills needed for professional-quality output
- ✓ CSV upload makes data import straightforward
Cons
- ✗ Limited data source integrations beyond CSV files
- ✗ May struggle with very large or complex datasets
- ✗ Fewer chart types than enterprise visualization tools
- ✗ Free model raises questions about long-term sustainability
- ✗ Limited collaboration features for team use
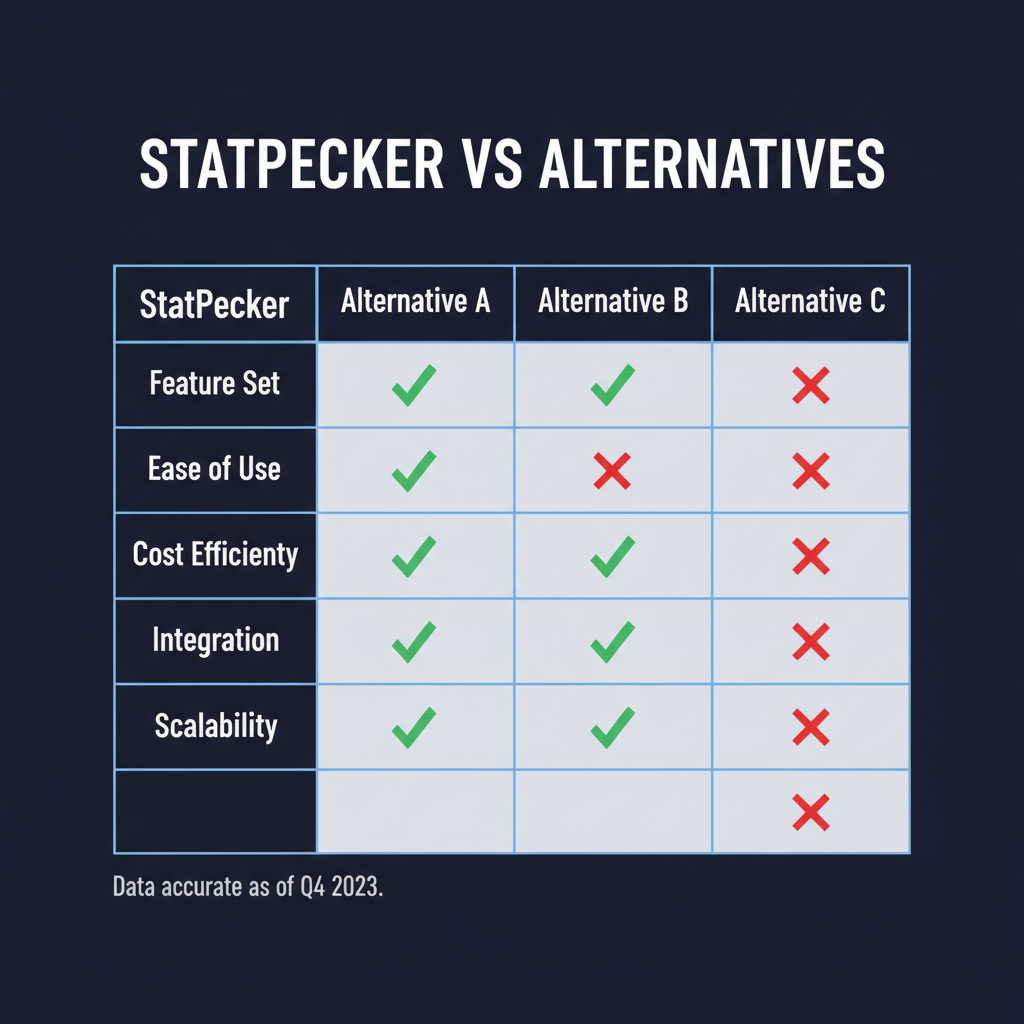
StatPecker vs. alternatives at a glance
Best StatPecker Alternatives

Final Verdict
StatPecker delivers a strong offering in the ai data visualization space. StatPecker is a free AI-powered data visualization platform that transforms raw data into compelling infographics and charts through natural language queries, making professional data storytelling accessible to non-technical users without design or coding skills. For content creators, marketers, business analysts, and non-technical professionals who need to communicate data-driven insights visually, it provides genuine value that justifies the investment. The platform is well-designed, the feature set is comprehensive, and the pricing is competitive for what you get. While not perfect, it earns its place as a solid option in an increasingly crowded market.
Our Rating: 4.0/5
Have You Tried StatPecker?
Share your experience with the PopularAiTools.ai community. Your review helps other users make informed decisions.
Submit Your ReviewFrequently Asked Questions
Is StatPecker free?
Yes, StatPecker is currently completely free to use with full access to all features, including CSV uploads, AI analysis, and visualization exports.
Do I need design skills to use StatPecker?
No, StatPecker is designed for non-technical users. Simply upload your data or ask questions in natural language, and the AI generates professional visualizations automatically.
What data formats does StatPecker support?
StatPecker primarily supports CSV file uploads for data analysis. Additional data source integrations may be added in future updates.
Can I embed StatPecker charts on my website?
Yes, StatPecker generates interactive visualizations that can be embedded in websites, blogs, and articles using simple embed codes.
How does the AI analysis work?
Upload your data and ask questions in plain English. StatPecker's AI analyzes your dataset to identify patterns, trends, and insights, then generates appropriate visualizations.
Can I export visualizations as images?
Yes, you can export your infographics and charts as high-quality images suitable for reports, presentations, and social media.
Is StatPecker suitable for business presentations?
Absolutely. StatPecker creates professional-quality charts and infographics that are suitable for business presentations, client reports, and executive dashboards.
Will StatPecker always be free?
StatPecker is currently free to use. The platform may introduce premium features or paid tiers in the future, but the core functionality is expected to remain accessible.

Get Premium AI Tool Insights
Subscribe to get weekly curated AI tool recommendations, exclusive deals, and early access to new tool reviews.
Related Tools
Related Articles
10 Claude Code Skills, Plugins & CLIs to Install on Day One (April 2026)
Starting Claude Code from scratch in 2026? Install these 10 skills, plugins, and CLIs on day one — Codex CLI, Obsidian, Autoresearch, Firecrawl, Playwright, NotebookLM, Skill Creator, RAG-Anything, Google Workspace CLI, and awesome-design-md. Full install commands included.
We Tested 24 AI Models Inside Claude Code: The 2026 Tier List
We swapped 24 different AI models into Claude Code and ran identical tool-call tests on each. Here's the S-tier-to-D-tier ranking, real cost comparison, and the single best Claude Sonnet 4.6 alternative for 2026 — including the GLM 4.6 sleeper pick that matched Sonnet at 15% the cost.
Claude as a Creative Studio: Make Ads, Images, and Video From One Chat (2026)
Claude doesn't generate raster images natively, but in 2026 it's the smartest creative director on Earth — orchestrating Nano Banana 2, Sora 2, Runway, Higgsfield, Remotion, and VEED into a single ad-and-video factory. The full stack, the variant matrix trick, and how to build a YouTube Shorts factory.